Community dashboards
Providing our community insights and analytics to continuously improve our hub performance and transparency on each stakeholder’s operations.
Intro
Statistics app:
- Helps you to get insight in the following questions:
- From where the freight handled at your airport comes from?
- How much of the local freight gets trucked away to other surrounding airports?
- Do we see a growth in the volumes of a specific commodity?
- The Statistics App collects all cargo manifest data, which creates insights on MAWB level in freight volumes, route (airport of loading/discharge and MAWB origin/destination), IATA flight type (Freighter, Pax...) and special handling code. Based on the above information, different reports can be defined.
Pharma Dashboard
- Consists of a personal dashboard per stakeholder (shippers, airlines, forwarders and ground handlers) and a benchmark dashboard on community level.
- The personal dashboard creates insight in your own quality performance based on the number of non-conformities following the IATA CEIV Pharma Acceptance Checklist.
- The benchmark dashboard shows the community quality performance.
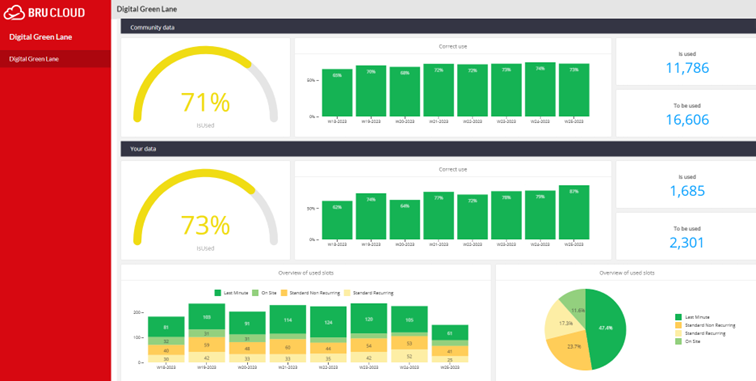
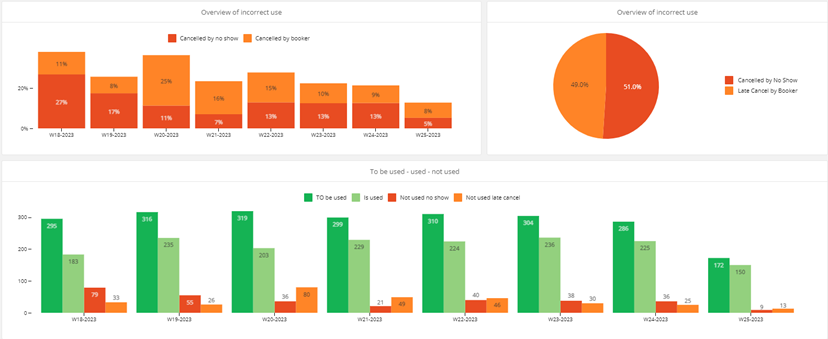
Digital Green Lane dashboard
- Delivers an overview of number of slots booked at Ground Handling Agents to deliver or pick-up freight
- Allows each stakeholder to compare its correct usage and performance compared to the overall community performance
- Provides the Brucargo community operator an overview of the correct usage and operational performance of the digital green lane process by the entire brucargo community
Screenshots
General
What value does it offer
- Operational Efficiency: Dashboards enable the identification of bottlenecks, inefficiencies, and areas for improvement within the brucargo community
- Transparency and Visibility: Dashboards provide real-time visibility into cargo operations, allowing community members to track their KPIs
- Performance Monitoring: Dashboards provide a comprehensive view of key performance metrics
- Enables data-Driven Decision making: By centralizing data from different sources, dashboards will allow brucargo
community members and the airport operator to make decisions based on accurate and up-to-date information. - Collaboration and Synergy: Dashboards serve as a central hub where different stakeholders in the cargo community
can access and share information. This fosters collaboration, enables data sharing and integration, and encourages partnerships among community members - Business Intelligence and Trend Analysis: allow cargo community members to analyze historical data, identify trends, and uncover valuable insights
Milestones of Community dashboards
Statistics app:
- 2016 Q1 – Go-live statistics app:
- all AWBs handled at BRUcargo are known in the BRUcloud and can be reused in other apps!
Pharma Dashboard:
- 2017 Q1 – Go Live pharma dashboard
- 2023 Q1 – Pharm dashboard 2.0
- Interactive and real-time dashboard available for the ground handling agents and forwarders
Digital Green Lane dashboard:
- 2022 Q4 – Go-live Digital Green Lane dashboard
- Key KPI’s from all Digital Green Lane partcipants included in one central dashboard
Information
- 2016 Q1 – Go-live statistics app
- 2017 Q1 – Go Live pharma dashboard
- 2022 Q4 – Go-live Digital Green Lane dashboard
- 2023 Q1 – Pharm dashboard 2.0
Goals
- Provide operational transparency for our key operational processes
- Capture events
- Performance monitoring